Paychex Inc is a company that supplies wages and financial systems (and outsourcing of such) to start-ups and small and medium sized enterprises. It has shown excellent growth since its formation in 1971, including previous recent quarters.
The share-price often rises around the time of its reports. Next quarterly report on 1 July. I have, therefore, placed a punt in anticipation of an imminent rise in value, following fall in recent weeks.
Killeens Financial Banner

Thursday, 26 June 2014

Tuesday, 3 June 2014
S&P 500: Expect a Double Peak
I have encircled the previous peaks to highlight the Double Peaks that tend to occur. I imagine we should anticipate a Double Peak again now, before the serious fall sets in.

Friday, 23 May 2014
Shipman's "Winning Strategy" found wanting
I have today evaluated the investment system advocated by Mark Shipman in his book "Big Money Little Effort" (2008), "A Winning Strategy for Profitable Long-term Investment."
My finding: not so profitable, tested on the S & P Index, 1991 to the present. See my Report.
My finding: not so profitable, tested on the S & P Index, 1991 to the present. See my Report.
Thursday, 22 May 2014
Moving Averages indicate Bank of Ireland not ready for our cash

Moving Averages indicate Bank of Ireland is still on Down-trend by KrunchieKilleen on TradingView.com
After a severe correction in 1999, Bank of Ireland trended strongly upwards between June 2000 and Dec 2006. 2007 to 2009 saw the company wiped out. After a brief and strong revival in 2009, the share slumped back to the floor. The 15-day Moving Average (coloured pink) gave warning of threatened down-swings throughout this history, including a warning of an imminent down-swing just before the crash. A Down-trend was certainly afoot when the graph cut through the 50-day Moving Average (coloured light green), confirmed when the shorter one also crossed under the 50-day Average. When the 15-day Average met the Support Line (coloured dark green), however, the down-trend was already clearly under way. By the time the time the short and medium term Averages cossed below the 100-day Moving Average, the brief revival of 2009 was happening and had ended, respectively. We move on to a One-year chart to continue the analysis.
Bank of Ireland analysis continued

Bank of Ireland analysis continued (One Year Chart) by KrunchieKilleen on TradingView.com
In this shorter term chart, it is the 50-day Moving Average (coloured light green) that keeps tabs on the uptrend; when the trend moved too far above this, a down-swing was imminent. (The shorter term, 15-day Moving Average, coloured pink, was riding too closely to the graph to be of much assistance except for very-short term trading). However, when the 15-Day line crossed under the 50-day line, the alarm bells should have been ringing. Shortly thereafter, the graph broke through the Support Line (coloured dark green). The current bounce in the share price is not yet sufficient to suggest that a recovery is afoot. We will wait until the graph cuts the 15-day line and then the 15-day line cuts through the 50-day line.
Even Apple can' afford to move too far ahead of its Moving Average

Even Apple can't rise too far above its Moving Average by KrunchieKilleen on TradingView.com
Three Moving Averages are shown on the chart: 100 day, 50 day and 15 day. It can be seen, in general terms, that when the share price of Apple, from the very start, moved strongly above its moving average, it always suffered a correction that brought it down to earth. Since 2004, however, it has escaped from its 100 day moving average, and even, though not quite as successfully, from its 50 day moving average. However, it has never escaped for too long from its 15 day moving average.In July 2012, it had departed severely from this indicator, so August brought it crashing down, through the 15 day and right down to the 50 day average. It has, at the present time again moved too far from the indicator, and is now due a severe correction.
Saturday, 17 May 2014
Euro to find new Norm
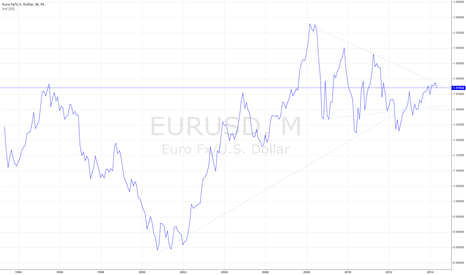
History of the Euro to the present had it oscillate around $1.375.The 2008 to 2014 simple Resistance Line (obtained by joining the peaks) now intersects this value. The downswing from here may reach no lower than 1.30 before swinging back to 1.35, but the trend will be downward and a new norm may emerge at a lower level.
Subscribe to:
Posts (Atom)